

Performance
Fast evaluations on a small footprint
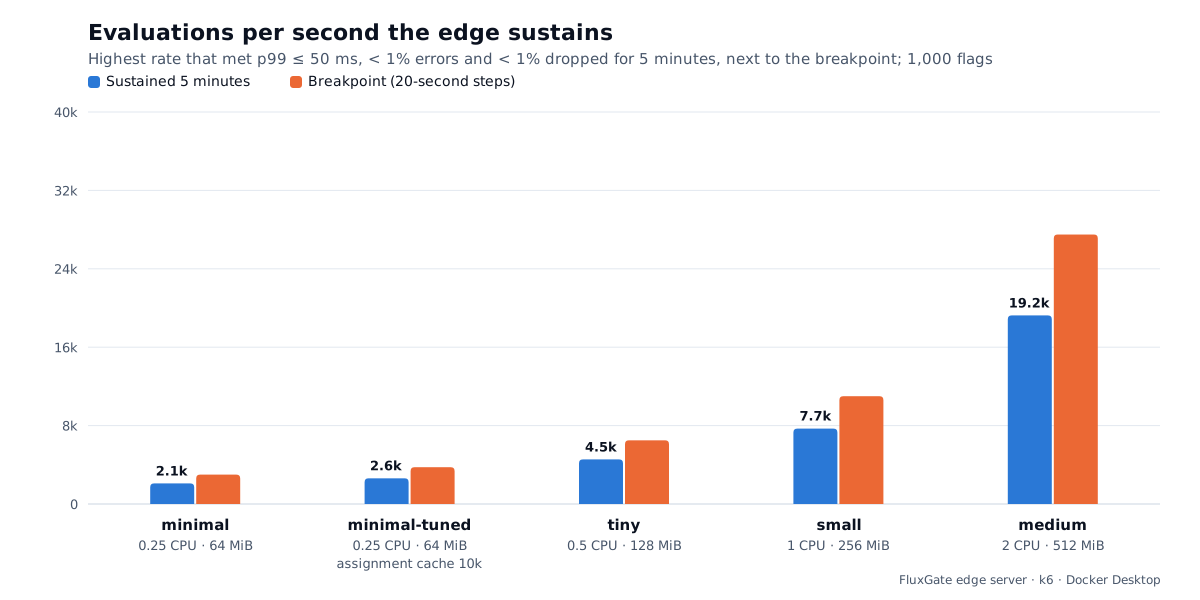
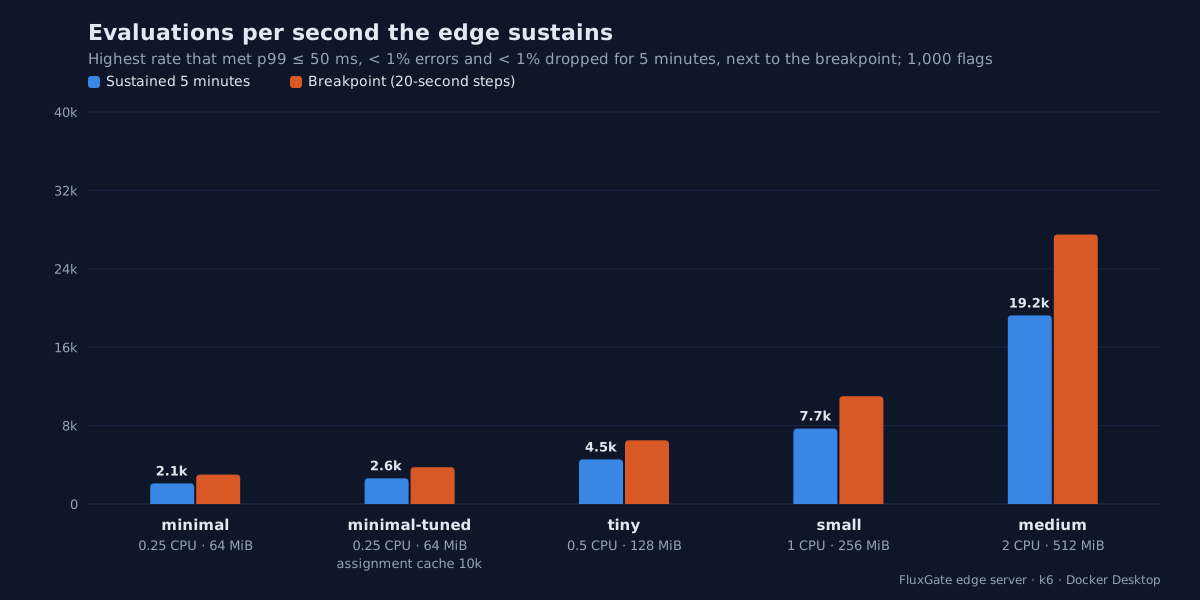
The edge server answers from memory. In 5-minute load tests it held 4,550 evaluations per second on half a CPU core and 128 MiB, with a median latency of 0.2 ms.
Measured results
What one edge server sustains
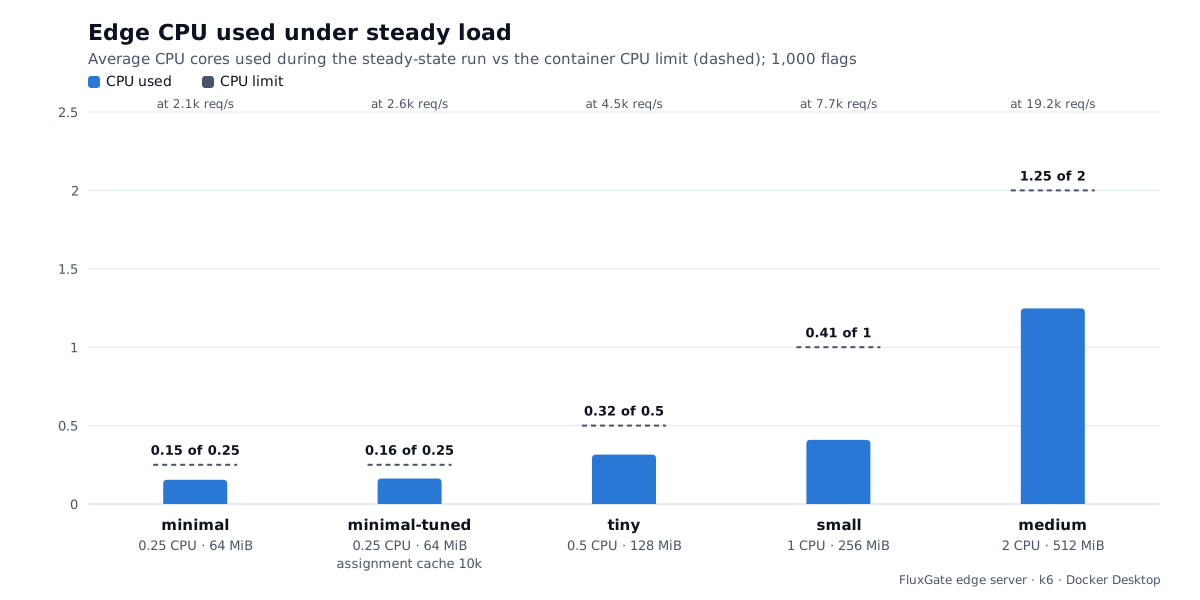
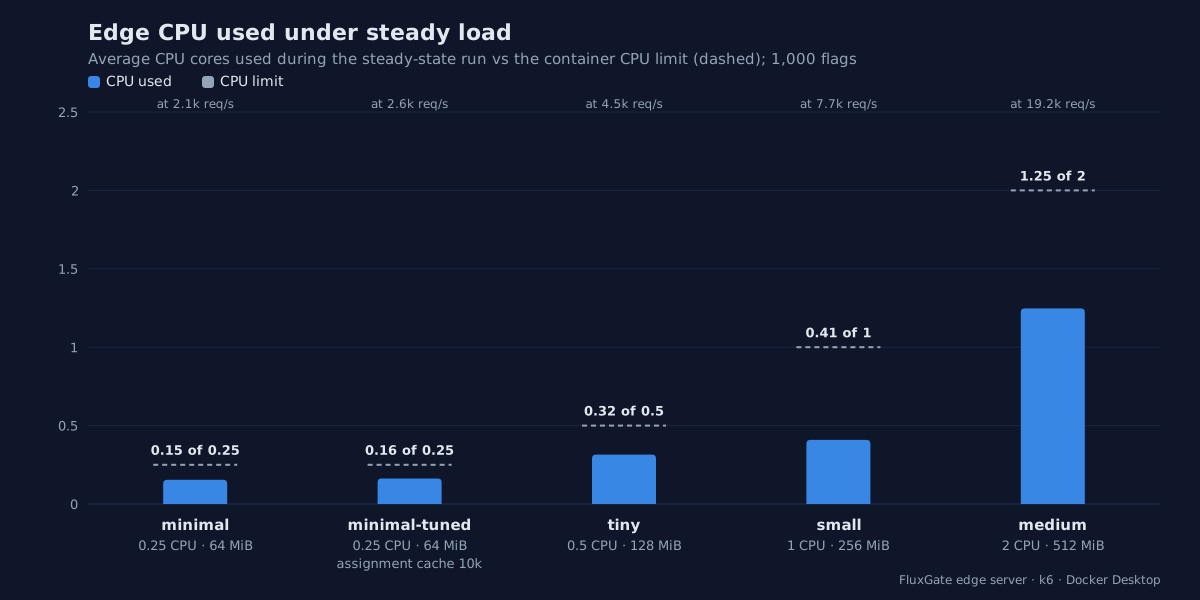
Each rate held for 5 minutes against 1,000 flags and 10,000 users, with p99 at or under 50 ms and under 1% errors and dropped requests.
| Edge limits | Evaluations/s | p50 | p99 | Edge CPU | Edge memory |
|---|---|---|---|---|---|
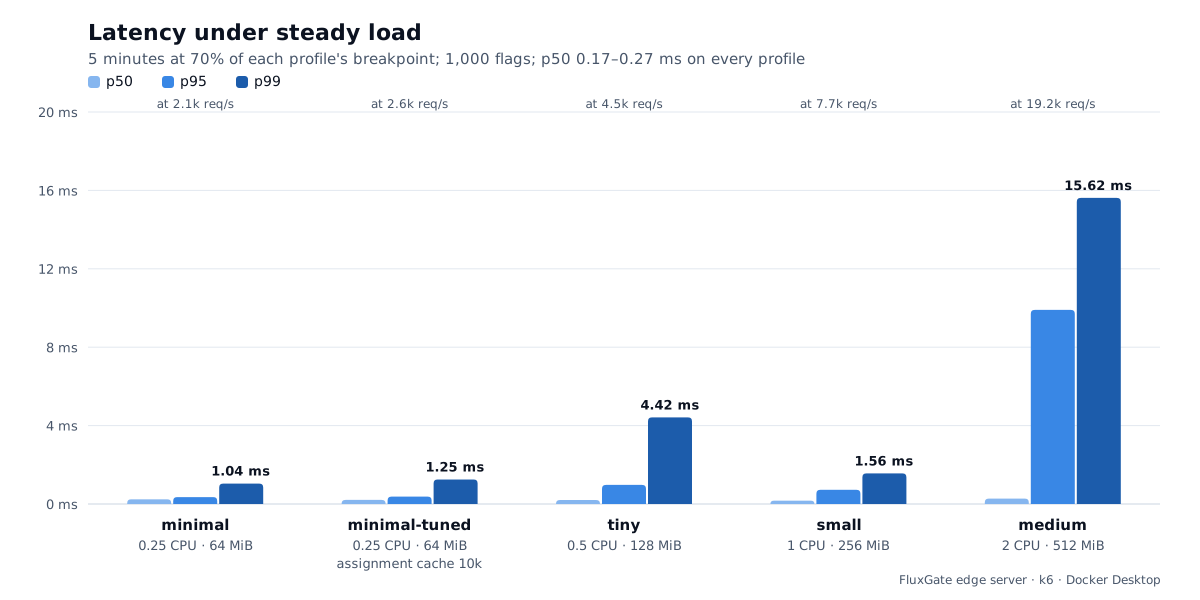
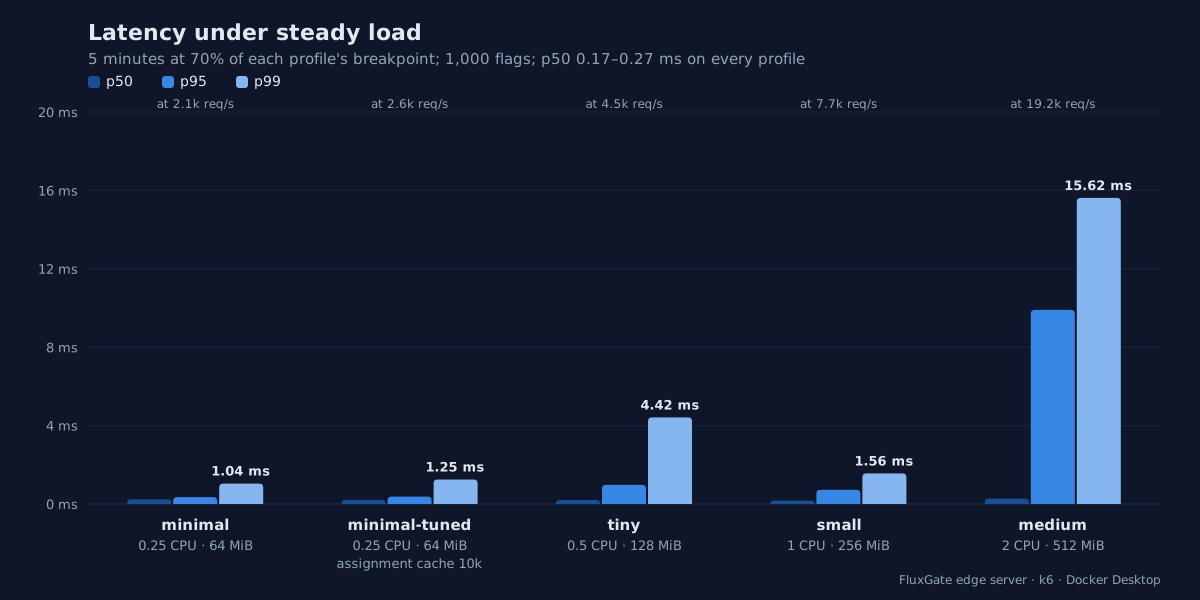
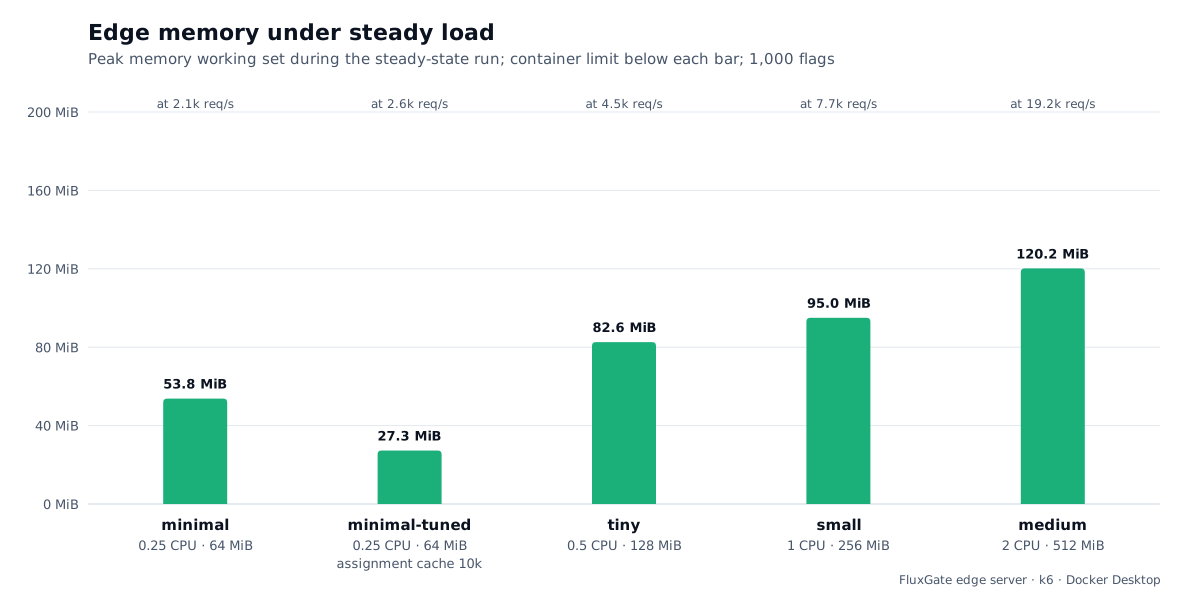
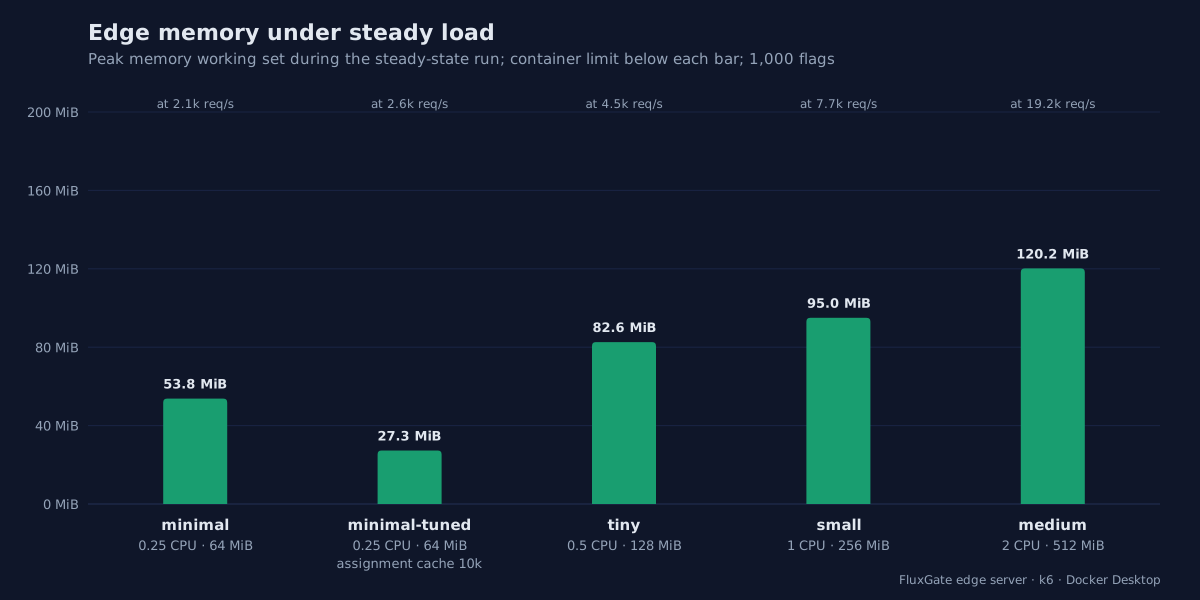
| 0.25 CPU, 64 MiB | 2,100 | 0.24 ms | 1.0 ms | 0.15 cores | 54 MiB |
| 0.25 CPU, 64 MiB, assignment cache 10,000 | 2,620 | 0.21 ms | 1.3 ms | 0.16 cores | 27 MiB |
| 0.5 CPU, 128 MiB | 4,550 | 0.20 ms | 4.4 ms | 0.32 cores | 83 MiB |
| 1 CPU, 256 MiB | 7,690 | 0.17 ms | 1.6 ms | 0.41 cores | 95 MiB |
| 2 CPU, 512 MiB | 19,250 | 0.27 ms | 15.6 ms | 1.25 cores | 120 MiB |
Edge CPU is the average used; edge memory is the peak.
How we tested
The test setup
- Endpoint
- POST /evaluate, one random flag per request, 10 context attributes
- Flags and users
- 1,000 deployed flags (700 boolean, 300 with variants), each with a targeting rule; 10,000 distinct users
- Load
- k6 at a constant arrival rate, so slow responses do not lower the offered load
- Pass criteria
- p99 at or under 50 ms, under 1% errors and under 1% dropped requests
- Sustained rate
- A freshly started edge holds 70% of its breakpoint for 5 minutes. The table shows that rate.
- Host
- Apple M4 Max with a Docker Desktop VM of 4 CPUs and 7.3 GiB, shared by the edge, backend, PostgreSQL and monitoring
- Limits
- CPU and memory limits apply to the edge container only
Read with care
What the numbers do not say
- Each run allowed up to 1% dropped requests. The runs dropped between 0.001% and 0.25%.
- In these tests the edge delivered at most about 2,000 evaluation events per second. Above 2,000 evaluations per second per edge, some events were dropped, so the dashboards undercount. Serving evaluations is not affected.
- Breakpoints from 20-second steps are higher than the rates that hold for 5 minutes. The table shows the 5-minute rates.
- These results come from one host. Your hardware, network and flag rules change them, so test with your own traffic before you size production.
Sizing
Choose an edge size
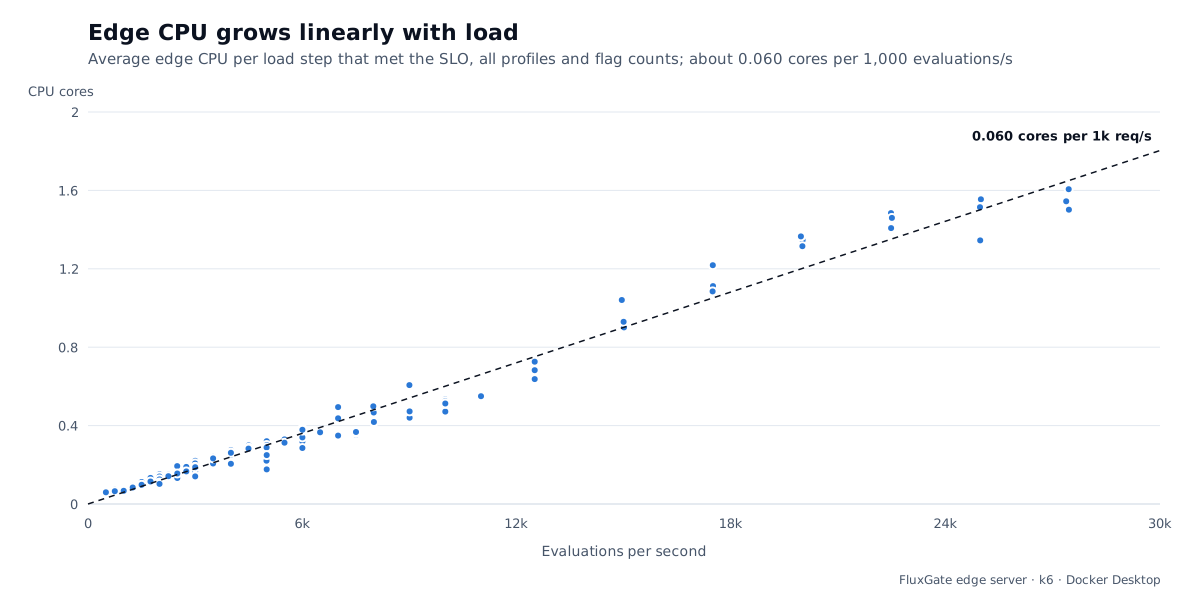
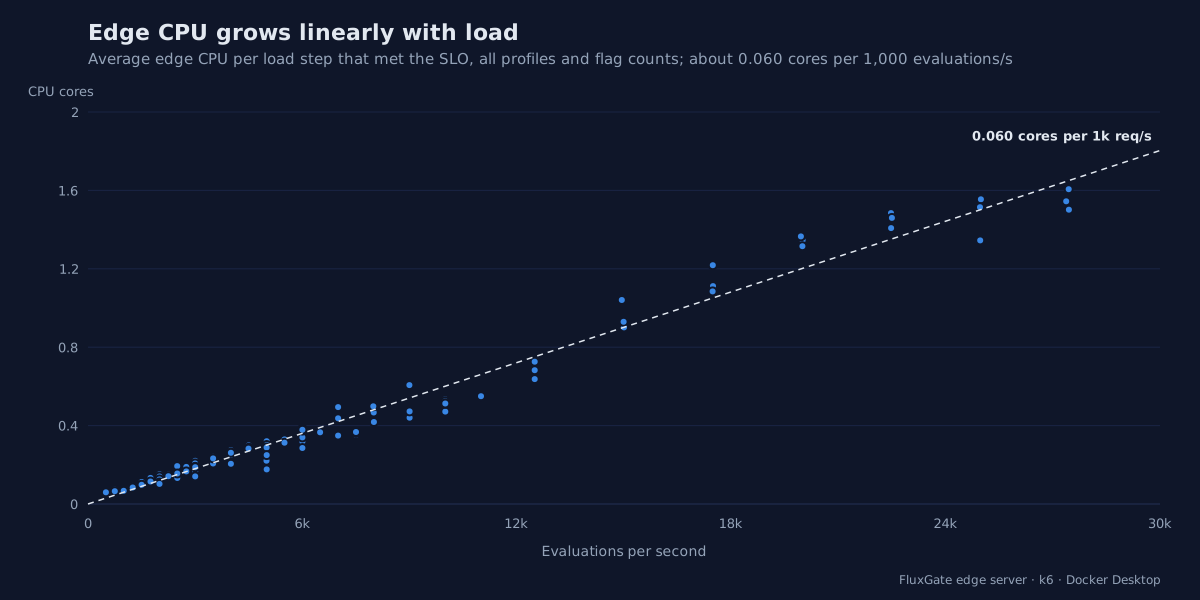
Pick the smallest size whose tested rate covers your peak traffic per edge server. Each rate was held for 5 minutes at 70% of that size’s breakpoint. Plan on about 0.06 CPU cores per 1,000 evaluations per second, from the fitted line.
| Edge limits | Held in tests, per second | p99 at that rate | Note |
|---|---|---|---|
| 0.25 CPU, 64 MiB | 2,100 | 1.0 ms | 2,620 per second with the assignment cache set to 10,000, at 27 MiB. Analytics undercount above about 2,000 per second. |
| 0.5 CPU, 128 MiB | 4,550 | 4.4 ms | |
| 1 CPU, 256 MiB | 7,690 | 1.6 ms | |
| 2 CPU, 512 MiB | 19,250 | 15.6 ms | Limited by the test host, not the edge |
The assignment cache is set with [cache] assignment_max_capacity in the edge configuration, or the EDGE_CACHE__ASSIGNMENT_MAX_CAPACITY environment variable. No size held more than 19,250 per second per edge in these tests, and setups with several edge servers were not tested.
Why it stays fast
Evaluation is an edge concern
A flag decision should not wait on admin CRUD paths. FluxGate keeps evaluation rules in edge memory, streams backend changes, and flushes analytics without blocking the response path.
Cached state
Initial snapshots and incremental updates keep edge nodes ready.
Deterministic logic
Bucketing, priority, and variants resolve predictably.
Build with ForgeOps LABS
Need feature flag delivery, platform tooling, or rollout automation?
FluxGate shows the kind of end-to-end software ForgeOps LABS builds: backend, UI, infrastructure, integration, and operational workflows.